Before You Start
Trait Profile reads the active Astro Clock chart.
- If you want to analyze a previously saved chart, load that saved snap into Astro Clock first and then open Trait Profile.
- If Astro Clock is still in
Realtime, Vox Stella pauses the live chart before the modal opens so the profile is built from a stable chart context. - Trait Profile does not ask for a second chart or a separate saved-snap selector inside the modal itself.
Screen At A Glance
- Trait Profile header
- Summary strip
- Top Positive column
- Top Neutral column
- Top Negative column
- Filter and action bar, including source filtering, domains, and
Copy AI Prompt
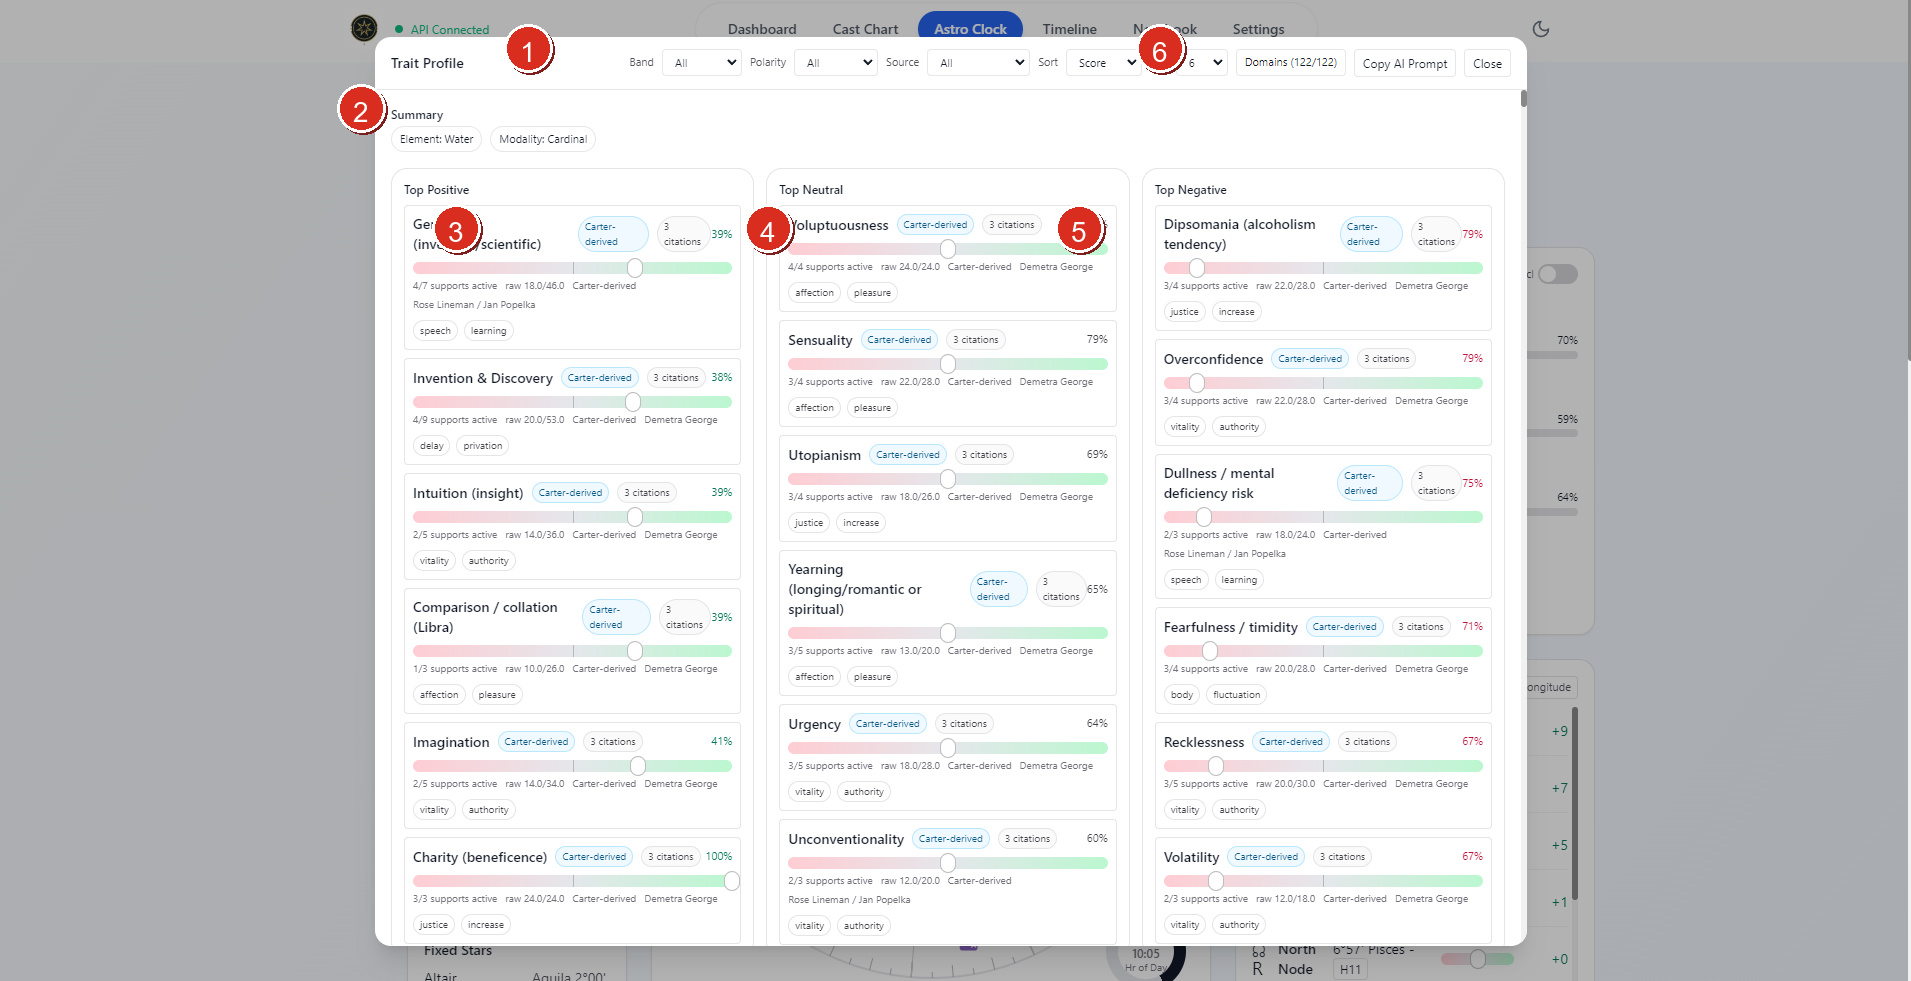
What The Modal Shows
The current modal is built around five main areas:
- a top filter bar for band, polarity, source, sort order, top-count, and domain selection
- a summary strip showing dominant element, dominant modality, and special chart flags when present
- top-trait splits for positive, neutral, and negative results
- Morin-style topic maps and house influence panels
- the full grouped trait list with source layers, citations, and evidence
Working With Filters
The top bar lets you narrow the profile without changing the underlying chart.
Band
Band filters the results by strength level.
The current UI supports:
AllStrongLikelyPossibleWeak
Polarity
Polarity narrows the result list to:
PositiveNeutralNegative
Source
Source filters the trait list by source lineage and enrichment layer.
The current UI supports:
AllMorin-facingClassicalModern
This filter does not change the chart. It changes which trait entries remain visible based on their attached lineage, keyword layers, and citation support.
Domains
The Domains menu is the broadest filter in the modal.
You can:
- search domains by name
- select all domains
- clear all domains
- choose a smaller domain set for a narrower read
If your filter combination returns no traits, the modal shows an explicit filter notice and a Reset filters action.
Summary And Top Traits
The summary area gives the quickest reading of the current chart profile.
It can show:
- dominant element
- dominant modality
- special degree tags
- chart flags such as
Mercury ShockorNeptune Station/Angularwhen those signals are active
Below that, the modal splits the strongest returned traits into:
Top PositiveTop NeutralTop Negative
This is the fastest way to understand the overall balance of the current chart before reading the full grouped list.
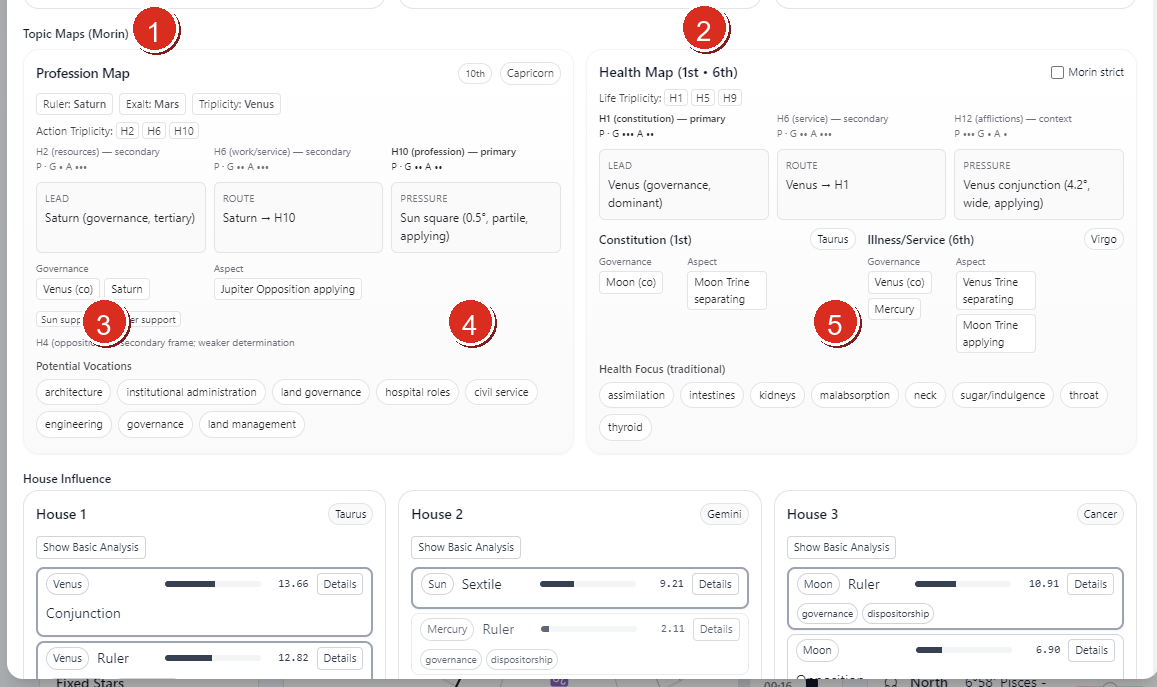
Topic Maps And House Influence
Profession MapHealth Map- Determination-support chips and route notes within the topic maps
Pressureand similar determination-route cards inside the profession map- House-linked governance and aspect cards inside the health map and the start of
House Influence
Trait Profile is not only a trait list. It also exposes chart-derived structure panels.
Topic Maps (Morin)
When the required house data is available, the modal can show Morin-style topic maps such as:
Profession MapHealth Map
These panels use current house influence data, rulership structure, and supporting chart conditions to summarize the strongest determination routes around those topics.
House Influence
The House Influence section expands the chart house by house.
Each house card can show:
- the house sign
- the strongest occupying, ruling, co-ruling, or aspect influences
- keyword chips for the strongest influence entries
- a
Show Basic Analysistoggle when a basic-analysis block exists - a
Detailsview for the scoring breakdown on a given influence row
This is the main place to inspect how the engine is building trait-relevant area pressure from the chart.
Reading Trait Cards
The full All Traits section groups traits by domain and orders the groups by stronger aggregate results first.
Each trait card can show:
- the trait name
- its domain
- its score and support count
- polarity direction
- description and evidence
- source lineage label
- source-layer keyword groups
- corpus citation support when available
The compact keywords on each trait remain the Morin-facing layer. The broader source layering appears separately under Source Layers and Corpus Citations.
Copy AI Prompt
The Copy AI Prompt action prepares an analysis prompt from the current Trait Profile state.
That prompt is based on:
- the active chart context
- the current filters
- the current trait results
If you want the copied prompt to reflect a specific saved chart, load that snap first before opening Trait Profile or copying the prompt.
Practical Workflow
For most users, the cleanest Trait Profile workflow is:
- load the chart you want Astro Clock to hold
- save and reload a snap first if you want an older chart rather than the current live one
- open
Trait Profile - read the summary and top positive, neutral, and negative splits
- use
SourceandDomainsto narrow the read when needed - inspect
Topic Maps (Morin)andHouse Influencewhen you want the structural basis behind the trait list - move into the full grouped trait cards for descriptions, source layers, and citations
- use
Copy AI Promptwhen you want to continue the analysis elsewhere from the same filtered result set
Notes
- Trait Profile works from the active Astro Clock chart, not from a separate chart picker inside the modal.
- Loading a saved snap before opening the modal is the reliable way to analyze a specific stored chart.
- Source filtering can legitimately produce no results when the current chart and current domain selection do not contain traits for that lineage.
- The profile combines chart metrics, house influences, and source-aware enrichment. It is broader than a single keyword list.