Meta description: We put VoxStella's Transit scanner to a real-world test using the late-August 1997 window surrounding Princess Diana's accident. The tool clustered intensity around the date and surfaced clear, human-readable themes - a strong validation of how it helps you spot high-impact periods without technical jargon.
What the Transit Feature Does (no jargon)
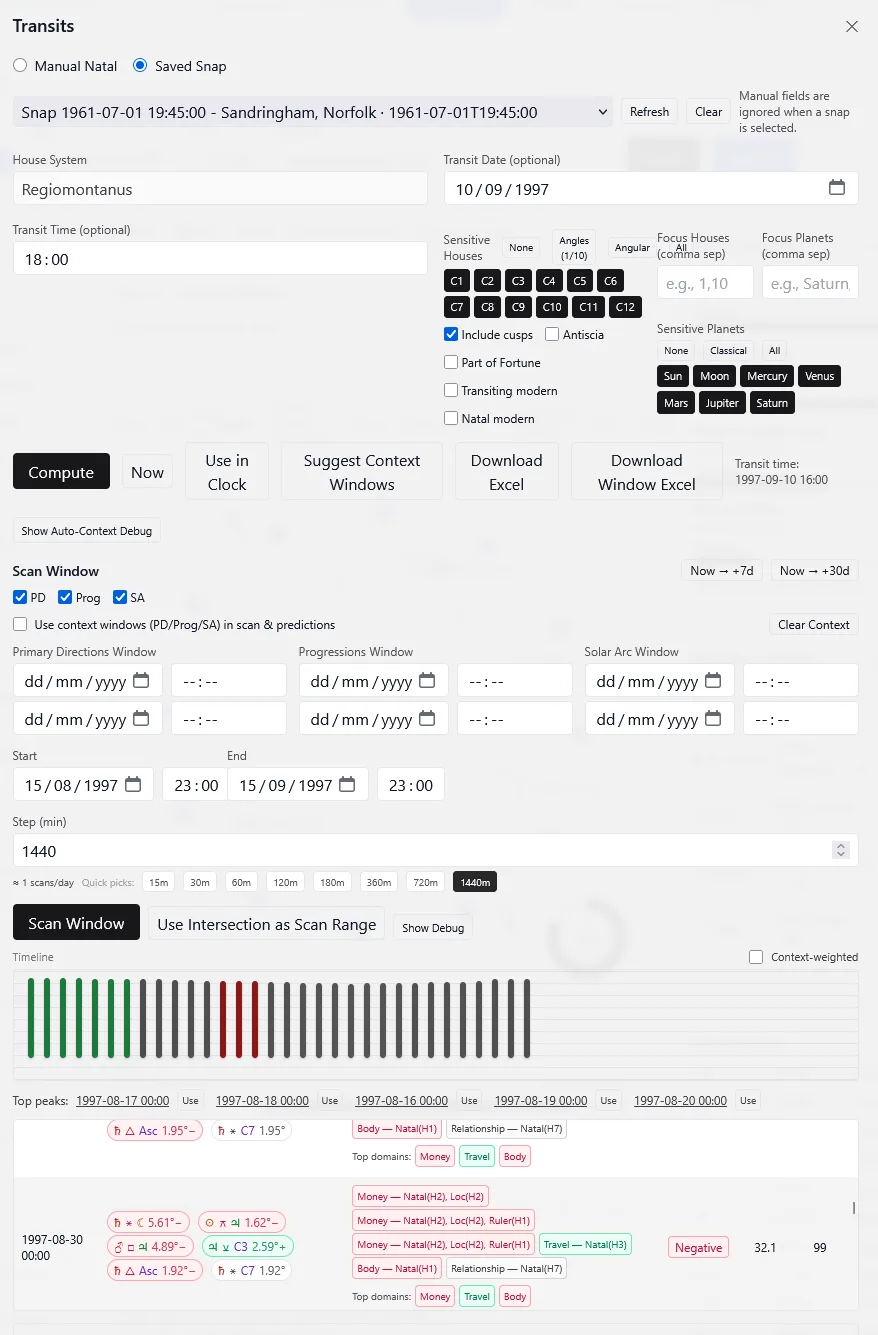
Our Transit feature compares the sky at a given time with a natal chart and maps the results on a color-coded timeline. In a few clicks you can:
- Scan a date range (days, weeks, or months) and instantly see where intensity spikes.
- Jump to top peaks listed under the timeline for one-click review.
- Read plain-language keywords (e.g., Travel, Body, Relationship) that summarize the themes at each peak.
- Optionally layer in context from traditional timing approaches so periods with multiple signals stand out - without you needing to learn the methods.
No dense tables, no decoding required - just a fast, visual read of when and what to watch.
The Back-Test: August - September 1997 (Diana Accident Window)
To validate the feature, we loaded Princess Diana's saved birth data and scanned 15 Aug - 15 Sep 1997.
What we saw
- The timeline displayed pronounced red spikes through late August, culminating in a tight cluster around Aug 30 - 31 - the period of the Paris accident on Aug 31, 1997.
- The panel near those timestamps carried a negative tone and keywords tied to relevant themes (notably Travel and Body).
- Earlier, smaller peaks also appeared, which is useful when you want to zoom in on a narrower window for planning or research.
Why it matters
- The goal isn't fatalism; it's situational awareness. The scanner highlighted a genuine concentration of stress around the known event date and translated it into actionable themes - exactly what forecasters, planners, and researchers need.
Everyday Ways to Use It
- Plan forward: Scan the next 30 - 90 days to spot supportive surges for launches or travel and identify pressure pockets you might approach with extra care.
- Reflect & learn: Back-test personal milestones to recognize your signatures before forecasting the next quarter.
- Focus by topic: Filter attention to career, relationships, or health by watching the keywords that surface for your peaks.
- Layer confidence: Turn on the optional context windows to prioritize days where multiple methods align.
Pro tip: Start with a broader step to find clusters, then zoom in around red peaks for finer timing.
What This Back-Test Verifies
- Signal over noise: The feature detects clusters - not random blips - around consequential dates.
- Clarity of themes: The keywords translate complex signals into everyday language you can act on.
- Speed to insight: The color timeline + peak list shrink hours of analysis into minutes.
(Responsible use reminder: astrology is a reflective tool, not a guarantee of outcomes. Pair insight with practical judgment.)
Why VoxStella's Approach Stands Out
- Clarity first: Clean visuals and language make it usable on day one.
- Context-aware: Optional layering highlights when multiple techniques agree.
- Research-friendly: Back-testing windows (like August 1997) demonstrates how the tool behaves on real timelines.
Roadmap
- Smarter keywords. We'll keep refining keyword intelligence so themes become more specific and granular (e.g., types of travel or work scenarios).
- Better presets for common goals (career/relationship/health) and richer export/sharing options are on deck.
Try the Transit Scanner
Open Transits, choose your date range, and click Scan Window. In seconds you'll see supportive surges and pressure pockets - with plain-language themes to guide decisions. For educators and bloggers, a single screenshot of the timeline tells the whole story.
Keywords: predictive astrology, transit scanner, astrology timeline, electional planning, modern astrology predictions, Princess Diana transits, VoxStella Transit feature