
We originally published these tests as three separate posts in October 2025. This page brings them together with one consistent description of the method and the caveats that apply to all of them.
How the transit scanner works
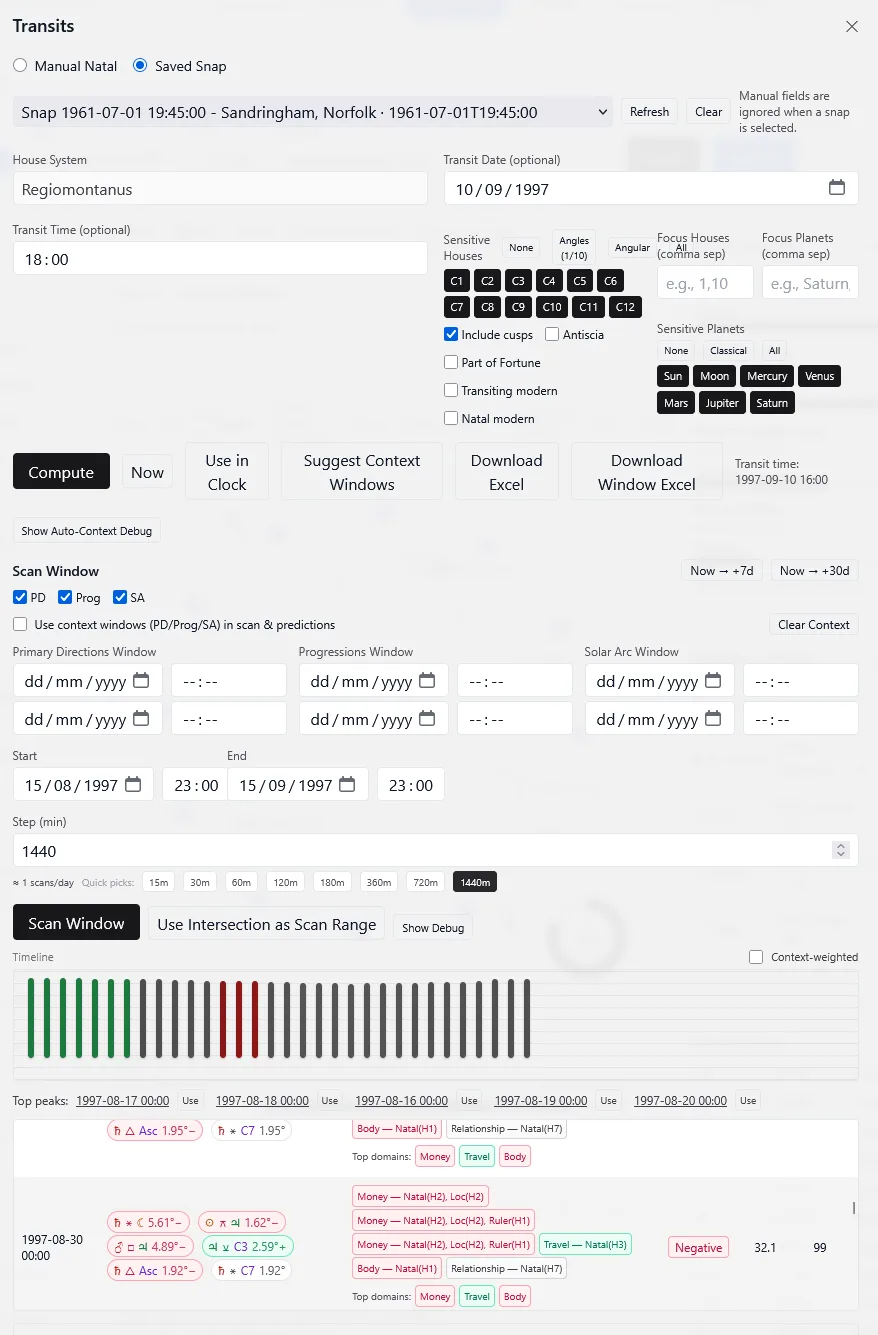
The Transit feature compares the sky at each step of a date range with a natal chart and scores what it finds. The score weights each contact by planetary speed, aspect type, orb, and house involvement, with extra weight for the angles; aspects are calculated with Morin-style spherical geometry, which accounts for planetary latitude. The results appear on a color-coded timeline (red bars where Mars and Saturn dominate, green where Jupiter and Venus dominate), with a list of top peaks, a positive or negative tone, and plain-language keywords for each peak.
Backtest 1: Tiger Woods’ accident, February 2021
On February 23, 2021, Tiger Woods was seriously injured in a single-vehicle rollover in Rolling Hills Estates, California; the 911 call was logged at 7:12 AM PST. His birth data (December 30, 1975, 10:50 PM, Long Beach, California) carries an AA Rodden rating, meaning it comes from a birth certificate or record.
- Settings: scan February 1–23, 2021, daily steps, angular houses (1, 4, 7, 10) as sensitive points.
- Result: the three highest negative scores in the window fell on February 21 (44.4), 22 (44.8), and 23 (44.8). The accident happened on the morning of February 23.
- Themes: the auto-generated keywords for those days were "Injury risk", "Career strain", "Malefic", and "Negative", driven by applying hard aspects from Mars to the Midheaven and Saturn aspects to the angles.

Caveat specific to this test: the scan window ended on the accident date, so it cannot show whether the scores stayed high, or rose further, in the days after.
Backtest 2: Princess Diana, August 1997
Diana, Princess of Wales, died after a car crash in Paris on August 31, 1997. We loaded her saved birth data and scanned August 15 to September 15, 1997.
- Result: the timeline showed pronounced red spikes through late August, culminating in a tight cluster around August 30–31, the dates of the crash.
- Themes: the peak carried a negative tone with the keywords Travel and Body.
- Also visible: smaller earlier peaks, which a forward-looking user would have had no way to rank against the later one.
Backtest 3: Donald Trump’s election days
This test compared two outcome-anchored windows for one chart (natal: June 14, 1946, 10:54 AM, New York): the presidential election he won in 2016 and the one he lost in 2020.
- Settings: Regiomontanus houses; the seven classical planets; cusps and antiscia on; roughly one-month windows in October and November; 12-hour steps.
- Election he won: day tag Positive, score about 53.4 from about 101 active contacts, led by career and public status (10th house) and friends and networks (11th). The timeline was red early in the window and turned greener toward the decision.
- Election he lost: day tag Negative, score about 57.1 from about 117 contacts, led by friends and allies (11th), career (10th), money (2nd), and shared resources (8th). A green run before election night gave way to red and gray bars with tall negative spikes after it.


The scanner measures the transit climate for one chart; it does not forecast elections. Note also that the losing window scored higher overall: the tag reflects the balance of supportive and challenging contacts, not the size of the score.
What these backtests do and do not show
The tests are useful as demonstrations: they show that the scanner’s scores and keywords respond to configurations around known events, and they document settings that anyone can rerun. They are not validation, because:
- They are retrospective. The events, dates, and outcomes were known before each scan, and the windows were chosen around them.
- There is no baseline. None of the tests compared the event window with ordinary periods for the same person, or with other people’s charts on the same dates, so there is no way to say how unusual the peaks are.
- The sample is three famous people. Choosing well-known, dramatic cases favors memorable matches; a fair test needs many cases chosen in advance, including events where nothing was flagged.
- Keywords invite matching. Broad labels such as "Travel", "Body", or "Career strain" can fit many real events, and reading them after the fact makes a fit easy to find.
Formal studies of astrology, such as Shawn Carlson’s 1985 double-blind test published in Nature, have not supported astrological claims. Treat transit scores as a structured way to review a period, not as a forecast of events, and never as a reason to make safety, health, or financial decisions.
Reproduce the Tiger Woods scan
- Open the Transit feature.
- Enter the natal data: December 30, 1975, 10:50 PM, Long Beach, California.
- Set the scan window to February 1–23, 2021, with a step of 1,440 minutes (daily).
- Choose the angular houses (1, 4, 7, 10) as sensitive points and run the scan.
- Review the timeline and top peaks for February 20–23. Then extend the window past the event date to see what happens next.
Using the transit scanner day to day
- Review a period: scan a past month to see which contacts were active around milestones you remember.
- Plan ahead: scan the next 30–90 days to see when supportive or challenging contacts cluster, then zoom in with a finer step.
- Read the breakdown: every day tag can be opened to show the exact aspects, orbs, and phases behind the score.
Sources
- Birth data and Rodden ratings: Astro-Databank.
- Event dates and times: contemporary news reports and public records of each event.
- Jean-Baptiste Morin, Astrologia Gallica (1661), on which the aspect geometry is based.
- Shawn Carlson, "A double-blind test of astrology", Nature 318 (1985): 419–425.